Data | The Collapse of Silicon Valley Bank and Signature Bank Amid Rising Interest Rates and Asset Losses Premium
The Hindu
Rising interest rates to target inflation may lead to a bank contagion
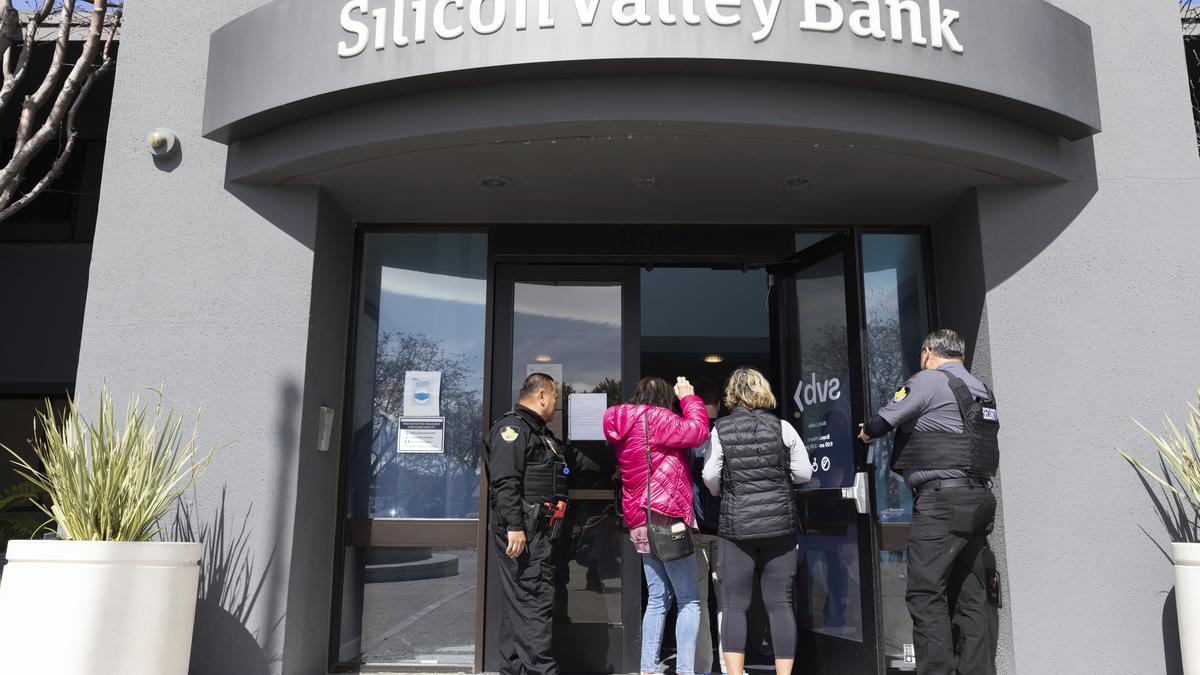
Silicon Valley Bank has gone belly-up as has the Signature Bank in the U.S. in the last few weeks. Another bank, First Republic, seems to be heading the same way. Why does a bank run happen?
Every bank has two sides — liabilities and assets (Table 1). We deposit our money in a bank for safe-keeping or to earn some interest because cash is a barren asset otherwise. But we do so under the assumption that we can withdraw our money any time we like. A bank run usually happens when a significant number of depositors believe that the bank cannot honour its commitment. After all, banks do not sit with liquid deposits; instead, they use them to create assets — loans — and to buy government bonds. If, however, the bonds lose value or the loans become non-performing, the banks may not be able to honour its commitment to the depositors.
Table 1
Charts appear incomplete? Click to remove AMP mode
Charts 1A and 1B show the extent of the unrealised losses that Silicon Valley Bank and First Republic Bank have been making of late as a result of a dramatic fall in bond values. One way of understanding the negative bars is to think of them as the proportion of the total deposits the banks cannot honour. Even this may not necessarily lead the depositors to withdraw en masse provided their deposits are insured i.e. the state promises to honour the deposits even if the banks cannot. Further, the banks could allay the fears of the depositors if they had either cash or short-term assets in significant amounts. Unfortunately for these banks, neither was a significant share of the deposits insured nor did the banks hold near-cash assets in adequate amounts.
The next question to ask is, why were these banks losing on their assets side? And the reason is simple — a rise in the interest rate by the U.S. Federal Reserve. Any asset holder has a choice of holding assets of differing maturities. If these returns are arranged term-wise, which is called a yield curve, an asset of 30 years of maturity should give a higher annual return compared to, say, one with a one-year maturity; otherwise, nobody will hold the former.
Chart 2 plots the yield curve for the U.S. before and after the steep rise in the Fed Funds Rate (the policy rate that Fed controls). When the Fed increases the interest rates, the returns for new assets of all maturities rise. But the old assets are still fetching lower yields, so those holding the old assets lose value notionally as we saw in Chart 1. Additionally, this rise may not be uniform. In fact, the yield curve can even get inverted with the shorter-term assets giving higher returns than longer ones, as is the case in the U.S. currently. For the depositors, it makes sense to move away from such risk-ridden deposits with very low yields towards short-term risk-free treasuries, which the Fed will always honour. Both these reasons feed into a bank run.

MTNL shares surge 18% after earning ₹2,134.61 crore from land monetisation, government informs Parliament. Market benchmarks rise.

February 2025 saw a 2% increase in passenger vehicle sales in India, with upcoming festivals expected to boost demand.

Fitch Ratings revises outlook on Adani Group entities to Stable, affirms 'BBB-' rating, and takes rating action on other bonds.

Equity market benchmarks Sensex and Nifty rise on strong domestic data and global trends, led by ICICI Bank and Reliance: Follow The Hindu’s updates on the Sensex and Nifty

Scopely will pay $3.5 billion to acquire Niantic’s game unit, including the studio behind Pokemon Go.

Follow The Hindu’s updates on the rupee : Mumbai forex analysts report on rupee's gains against the dollar amid global tariff tensions and economic data.

The U.S. Federal Trade Commission is moving ahead with an antitrust probe of Microsoft, Bloomberg News reported.

Intel hires semiconductor industry veteran Lip-Bu Tan as CEO to revive struggling company amid leadership changes and financial challenges.

Nandan Nilekani predicts India as top IPO market by 2035 with 1 million startups and $8 trillion economy potential.

BNW Developments partners with Taj to bring luxury living to UAE's Al Marjan Island, Ras Al Khaimah.

Equity indices Sensex and Nifty close lower amid global economic concerns, with IT and telecom stocks leading the decline.

Rupee closes at 87.19 against US dollar amid tariff uncertainties, crude oil prices, and global market volatility.

NCLAT rejects IRDA pleas against Shriram Group insurance arm mergers, citing no statutory bar under Insurance Act.