


A stitch in time: University student maps Edmonton's changing climate — on a quilt
CBC
Working toward a certificate in sustainability, University of Alberta student Emilia Housch spent 60 hours working on a visual demonstration of climate change in Edmonton.
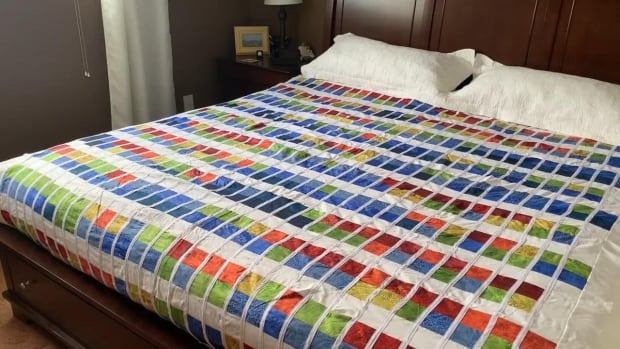
Her final product: a temperature quilt.
"I wanted to do something cool," Housch told CBC's Edmonton AM on Tuesday.
"Originally, I was going to do an infographic, and then I was like, no that's boring. Temperature quilt time!"
Temperature blankets are crocheted, quilted or knitted records of the temperature throughout a certain time period.
Housch's king-size quilt is checkered with 15 different colour patches from reds, blues to green and yellow, showing daily high and low temperatures for the month of February in Edmonton.
Rows stretching from left to right across the quilt show February in 10-year increments, from 1920 to 2020. The columns — from top to bottom — show each day of the month.
Housch used red to depict the warmest temperatures; the coldest are represented with dark blue.
The lowest temperature she recorded was –36.2 C on Feb. 23, 1940.
The highest was 11.2 C on Feb. 28, 1990.
The graph on Housch's quilt depicts extreme changes in temperatures, addressing a common misconception about how climate change only means a rise in temperatures.
"It's getting warmer, but it's also getting colder," she said.
The quilt shows rows of homogenous colours at the top that become progressively colourful by the bottom.
"The bottom is just very variable and it doesn't seem like the days are connected to each other," Housch said.
 Run 3 Space | Play Space Running Game
 Traffic Jam 3D | Online Racing Game
 Duck Hunt | Play Old Classic Game
Nancy Addison is still waiting for a house to come home to, one year after a wildfire raged through Jasper, Alta.

There's an app for that — even to help monitor people on bail in Ontario.

A fire at a waste facility in Wellington, P.E.I., on Saturday could have been much worse than it turned out to be.

It's been well documented by now that Canadians are drinking less than they used to, but no other province has seen a greater reduction than Alberta.

Canada's premiers are kicking off a three-day summit in Ontario's cottage country at a time of heightened anxiety over tariffs and trade with Canada's closest trading partner, the United States.

U.S. Commerce Secretary Howard Lutnick is dismissing the question of whether U.S. free trade with Canada is dead, calling the notion "silly" and saying a substantial amount of Canadian goods enter the U.S. tariff-free under the current North American free trade deal.

Howard Mah and Lori Arnason had never seen a wild grizzly until Saturday.

Police in New York state say they have found a nine-year-old Canadian girl who was reported missing in northeastern New York dead.

A 14-year-old has been arrested in the fatal stabbing of a woman in a North York parking lot last Thursday, Toronto police say.

It's been a big week for Tyrelle Chadwick.

Joanne Williams estimates she's taught 2,000 people how to make bentwood boxes.

Paula Callejas, a Montreal native, was trying to expand her swimsuit business in Florida after taking time off to take care of her ailing father in Canada before his death.

Across Alberta, more people are buying new vehicles even as prices have been shooting up.